How The Interest Rate Environment Affects This Relationship
By Matthew Jacobsen, VP
In June of 2006 the federal funds target rate was at 5.25%. From 2007 to the end of 2008 the rate was decreased to a range of 0.00% to 0.25% where it remained until December of 2015. Since that time, the target began to slowly increase to a range of 1.25% to 1.50% at the end of December 2017. During the decrease and subsequent increase, credit unions continued to see member deposit growth. This was counter to what some had expected given that rates paid on member deposits also dropped close to zero percent. However, taking a look at the historical member deposit mix and rates may offer a view of what they may do as rates rise.
From June of 2004 to June of 2006, when the federal funds rate hit its high for the cycle, member CDs increased from 16.37% of total member deposits to 19.61% (Graph 1). As the federal funds rate began falling, this percentage continued to increase to a peak of 24.97% in March of 2008. Following this peak, members CDs have now fallen to 13.02% of total member deposits. In June of 2007 the difference between the average member CD rate and average regular share rate was 3.22% (Graph 2). At the March 2008 peak, the difference was 2.32% as members took advantage of fixed rate-term deposits while interest rates were falling. In recent years, the difference has been as low as .40%. As of the end of the fourth quarter in 2017, this difference has increased to .57%. In assessing the member deposit composition at the end of 2017, we can see that this increase in the difference has not yet translated to an increase in member CDs as a percentage of total member deposits, but it is clear that member CD rates have started to increase whereas regular share rates have remained constant so far. What can we infer from these relationships and trends going forward?
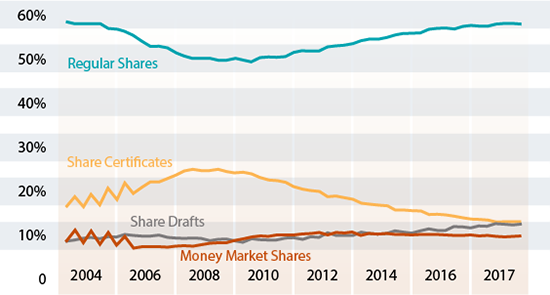
Mark H. Smith, Inc. Peer Analysis Balance Sheet Module
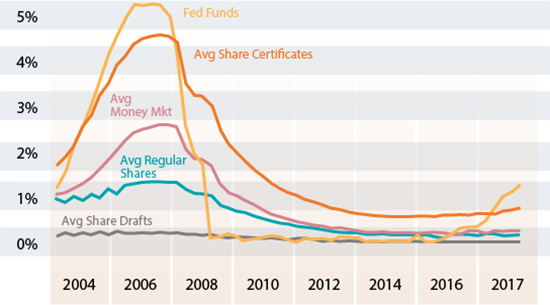
Mark H. Smith, Inc. Peer Analysis Interest Rate Module
Based on this historical assessment we can expect that as the federal funds target rate continues to rise, the difference between regular share rates and CD rates will continue to increase. As such we should expect the CD composition of member deposits to eventually start increasing as well. Will it get back to comprising approximately 25% of total member deposits? It is tough to say at this time, but keeping an eye on the difference in average member CD rates compared to the average regular share rate can certainly provide some insight. The credit union’s cost of funds will also increase proportionally as member CDs become a greater composition of total member deposits and the difference in CD rates and regular shares widens. Credit unions will want to consider this in their budgeting process in the coming years if the likelihood of the federal funds target rate continues to project higher.
In addition, the composition within member CDs also changed with the rate cycle. At the end of the fourth quarter in 2007, member CDs with less than 1 year maturities comprised approximately 79% of total member CDs (Graph 3). At the end of the fourth quarter in 2017, this percentage dropped to approximately 66%. On the other hand, member CDs with maturities between 1 and 3 years comprised approximately 18.5% of total member CDs at the end of the fourth quarter in 2007, but increased to approximately 27% at the end of the fourth quarter in 2017 (Graph 4). Member CDs greater than three years also increased from approximately 3% to 8% during this time period as members reached further out in term for greater yield (Graph 5). Will these trends reverse course also as interest rates rise? One plausible explanation why we may see this reversal is if members do not want to lock in longer-term fixed rate maturities as interest rates rise in anticipation of higher interest rates tomorrow. As with the regular share versus CD migrations, credit unions can utilize these balance sheet composition changes relative to the interest rate environment in their planning and asset/liability management.
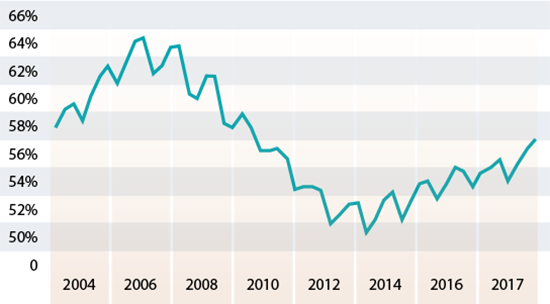
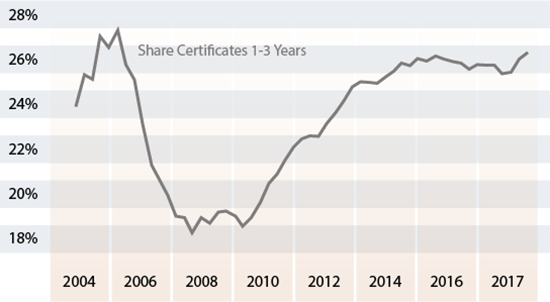
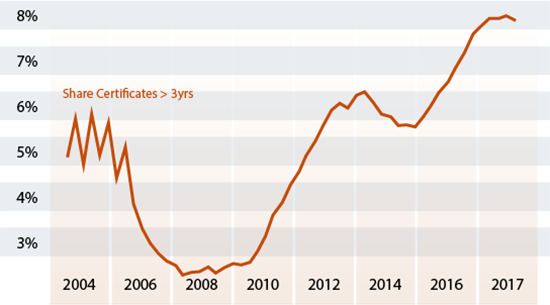
Mark H. Smith, Inc. Peer Analysis Balance Sheet Module
The migration between regular shares and CDs, the widening of rate differences between regular shares and CDs, and the migration between terms in CDs can vary greatly from region to region and credit union to credit union. When evaluating possible changes to deposit composition and cost of funds, especially in budgeting, all of these items need to be considered. It is even more important to look at these numbers for the specific credit union to accurately estimate possible changes. Our Peer Analysis can display these numbers by any selection of states, counties, or individual credit unions. Please contact us if you are interested in how the MHSI Peer Analysis can further help your credit union.
