BY CYNTHIA R. WALKER, CEO
“Mary, Mary, quite contrary, how does your garden grow?” is the beginning of a popular nursery rhyme and comes to mind while thinking of how the credit union system has grown and changed over the last 10 years.
As of June 2007, total shares and deposits for all credit unions based on cumulative call report data was $593 billion. The latter part of 2015 shares and deposits surpassed a trillion dollars and are currently above $1.15 trillion. The total number of members has increased, but it is worth noting that average savings/member has also increase during this time from $5,390 to $8,037.
This article is going to focus on some of the changes and shifts noticed in the credit union balance sheet. The statistics referenced are cumulative results for credit unions ranging in size from $10 Million to $500 million in total assets. The time frame for comparison is June 2007 through June 2017.
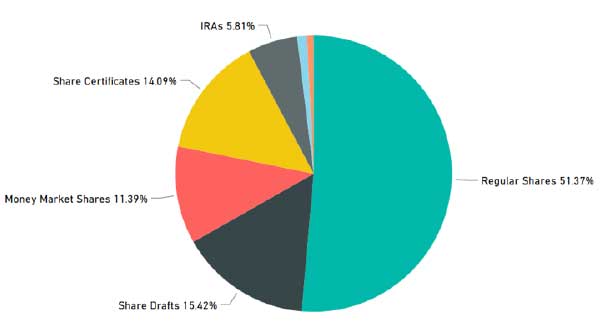
As shares and deposits grew, there was also a shift in the makeup of the deposits. At the beginning of this comparison, certificates represented 27.1% and declined to 14.1% of total deposits, regular shares were 41.7% and increased to 51.4%, money markets transitioned from at 9.5% to 11.4%, and share drafts climbed from 12.4% to 15.4%.
From cost of funds and an interest rate risk perspective, this shift has been advantageous for credit unions. With interest rates at historical lows, many depositors were still not discouraged, and it appears safety was a priority over yield for these depositors. Moving forward as fed fund rates are expected to rise during 2018, will safety remain a priority, will funds leave the credit unions, or will deposits migrate from lower cost funding to more expensive funding. Each scenario or a combination of these scenarios should not be ignored. This topic will be addressed in another article in this newsletter.
DEPOSIT COMPOSITION 2017

Average annualized loan and investment income hit a high in the 4th quarter of 2007 and then started its decline. Loan and investment rates decreased more than some deposit rates because many of these rates were reduced to almost zero. The compressing net interest margin and impacted net income. The low income combined with the growth caused a deterioration in net worth ratios – although in my opinion, not detrimentally for most credit unions. The average net worth ratio for credit unions was 13.30% in 2007 and comes in at 11.79% as of June 2017.
The credit union garden is growing, and there are more assets to invest than in the past. Where are the resources being invested and are they getting the best harvest or return?

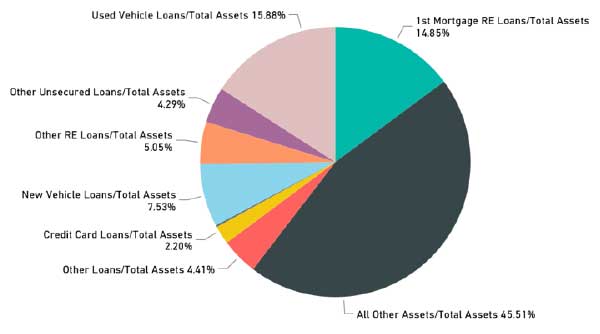
Loan composition to total assets has changed. The biggest shift has been a decrease in new vehicle loans from 12.3% to 7.5% of total assets. Other RE loans also decreased from 9.7% to 5.1%. Used vehicle loans increase slightly to 15.9%. 1st mortgages and the rest of the categories did not change enough to mention. In addition, loan growth did not keep pace with deposit growth and total loans to total assets declined from 62.7% in 2007 to a low of 50% in 2013. Loan growth has since surpassed deposit growth and has climbed slowly to 54.5% in 2017. Loan interest income was at a high of 482 basis points in Q4 of 2007 and continues to decline, though not as rapidly, and is now at 283 basis points.
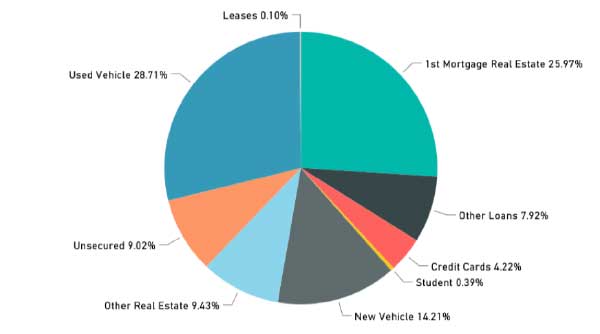
The decline in total loans to total assets leaves a trend that is worth noting behind the scenes. While fixed rate first mortgages remained relatively constant over time as a percentage of total assets for credit unions in the asset group for this article, 1st mortgages represent a larger portion (almost 26%) of the total loan portfolio. Credit unions over $500 million have consistently held more 1st mortgage fixed rate loans than their smaller counterparts and appear to be more comfortable with this approach.
LOAN COMPOSITION AS OF JUNE 2017
CREDIT UNIONS LESS THAN 500 MILLION

From my experience and considering the percentage of 1st mortgage fixed rate loans to total assets from 2007 to 2017, there has been minimal increase in interest rate risk due to mortgage loans and most credit unions I advised remain in a low interest rate risk range and well within their policy and regulatory limits. The mortgage products appear to still be an earnings opportunity for the smaller credit unions. Pursuing this opportunity should promote discussion around interest rate risk. Reviewing and analyzing regular IRR analysis will help to evaluate and manage interest rate risk and balance potential return against potential risk.
During this growth period when total deposits increased, but loan portfolios did not keep up, the investment part of the balance sheet is where most of the growth landed. Again, we look to answer the question of how did credit unions put the growth to work and are they getting the best harvest or return?
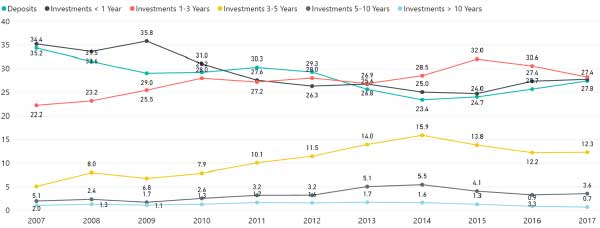
The net long-term assets/total assets ratio increased from 15.1% in 2007 to 23.9% in 2017, leading one to assume the investment portfolio terms increased to improve yield. The average weighted maturity of investments was 1.1 years in 2007, topped out at 1.9 years in the 3rd quarter of 2014, and currently hovers around 1.5 years.
Agencies and mortgage backed security investments as part of the total investment portfolio increased for credit unions in this asset group, but investment CD’s remain the primary investment vehicle. The larger financial institutions have shifted almost completely from investment CD’s to agencies. Investment income in basis points went from 140 in 2007 to a low of 44 basis points in 2013. Investment income has crept up since then to 52 basis points. Cash and overnight deposits remain a sizable percentage of the investment portfolio.
INVESTMENT COMPOSITION (%) BY TERM

What do I see as the take away from all this data? Credit unions’ managers have been able to keep the net interest margin relatively stable since 2013, although there has been little improvement. A large portion of the growth ended up in the investment portfolio, which is less beneficial than lending, and there is still a lot of low earning cash in the system. The garden has crept along but not flourished. Most credit unions’ Interest rate risk profiles remains low and the funding side of the balance sheets contain a significant portion in core deposits. Evaluating and exploring the tradeoff of taking more Interest rate risk, taking on some more mortgages, extending terms on investments, and weighing liquidity needs versus investing overnight deposits, may be opportunities to explore moving forward.
