By Matthew Jacobsen
Credit Union, Economic, and Interest Rate Expectations: Where Are We Now?
In March of 2016, the NCUA released credit union data for 2015 and noted that median growth rates for loans, assets, and shares were positive in all states. Median loan growth was 4.0% and median shares and deposits growth was 3.6%. The median loan-to-share ratio was 62% which was up slightly from the previous year. Total loan delinquency rates continued to decline. CUNA’s January 2016 CU Forecast for loan growth in 2016 is 9.0% with share growth at 6.0%. Their delinquency rate forecast for 2016 is .80% and earnings are forecasted to be .70%.
On the economic and interest rate fronts, economic growth in 2015 was generally moderate with a weakening bias towards the end of the year. The US Treasury bond curve flattened with the two-year US Treasury bond rate increasing 40 basis points on expectations of a Federal Reserve increase in the Fed Funds target rate while the 10-year US Treasury bond rate hovered around 2.25%. Sure enough, in December of 2015 the Federal Reserve increased the targeted Fed Funds rate by 25 basis points and further guidance at the time was for the possibility of four more rate increases in 2016. In the last Economic Outlook we discussed three potential interest rate scenarios to consider in 2016. To briefly recap, here are the potentials described at the time:
Scenario 1 - was consistent with the Federal Reserve’s guidance at the time and described a scenario of the Federal Reserve gradually increasing the Fed Funds target rate throughout 2016.
Scenario 2 - described an environment where economic weakness at the end of 2015 continued but still with positive economic growth, the U.S. Treasury yield curve continued to flatten, and the Federal Reserve increased the Fed Funds target rate at a much slower rate than was initially expected.
Scenario 3 - considered the possibility that economic weakness spread to other areas of the economy and the Federal Reserve took no further rate increase actions (or only a minimal number of them before stopping and potentially reversing the increases).
Where Are We Now?
Economic data during the first quarter continued to be mixed with certain areas remaining weak and other areas continuing to show expansion or improvement, albeit at a slower rate. Following the Federal Reserve Bank’s March 2016 meeting, their official statement said that “information received since the January meeting suggests that economic activity has been expanding at a moderate pace.” They further stated that “inflation picked up in recent months; however, it continued to run below the Committee’s 2 percent longer-run objective.” However, the Federal Reserve Bank’s Committee cited global economic and financial developments as continuing to pose risks. As such, guidance for further Fed Funds target rate increases was lowered to an estimated two increases in 2016.
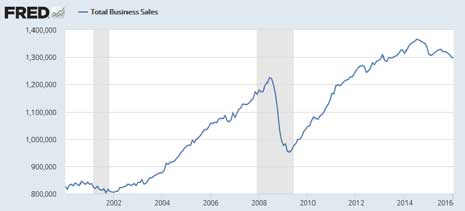
Recent global economic and financial instabilities do indeed appear concerning as the Federal Reserve Bank recently noted. For example, global trade overall has generally been decreasing over the last several months. Furthermore, certain other U.S. economic growth data points continue to be troublesome for the current domestic growth story. The overall total business inventories-to-sales ratio has continued to increase as reported by the Federal Reserve Bank’s economic data reporting (FRED). In addition, total business sales seem to have peaked in the Summer of 2014 as reported by FRED (see graph below in millions).

The current total business sales data point is only back to 2013 levels, but what path will the above graph take going forward?
Following the March 2016 Federal Reserve Bank’s meeting and statement, along with the above data points, have we now moved closer to Scenario 2 from Scenario 1? At this time, it may be too early to say that this is the case. However, the U.S. Treasury bond curve may be indicating this direction as the ten-year bond yield has decreased in 2016 from 2.24% to 1.88% at the time of this writing and the spread between the 2Yr and 10Yr bond continues to decrease so far in 2016. These are often (but not always) signs of a potentially slowing economy and more muted expected inflation pressures in the future. Given these considerations, if we are now moving closer to Scenario 2, will it be just a pause at Scenario 2 before moving on to Scenario 3?
As with the last Economic Outlook, regardless of which scenario you think will come to fruition the closest, we present these scenarios for the purpose of discussion and planning in your risk management endeavors. Furthermore, to reiterate what we said in past articles, managing the credit union’s interest rate risk, while maintaining healthy margins, regardless of the scenario, should remain at the forefront of priorities in 2016.
