
With the dramatic changes in the economy due to the Coronavirus, credit unions are wondering what they should expect moving forward. Even though this recession is unlike any other, we can look at data from the financial crisis, or the great recession, to get some clues as to what might happen.
Increased Deposits or “Surge Shares”
Starting in 2008, deposits increased substantially at almost every credit union and were often referred to as "surge shares". There was much debate as to whether the surge shares would eventually leave, but in the end, deposits did not decline but steadily increased for the next ten years. We have already seen a sizable increase in deposits at credit unions this time around, and we could see even more, especially as talks of another stimulus check are underway. Credit unions should plan for multiple scenarios, but a strategy to maximize profitability with the influx of deposits should remain a top priority. Unless additional deposits are needed for loan funding or the new deposits can be profitably reinvested, credit unions should employ strategies to minimize deposit growth and possibly even shrink deposits. Lowering deposit rates, including certificate rates, should strongly be considered if it has not already been done. Dropping deposit rates below competition rates may not be enough to discourage the inflow of deposits, but it is a critical component to maximizing the profit margin. If deposits leave due to low rates, then we know the money is rate sensitive and the credit union knows how to likely get it back when needed; just raise rates.
Change in Deposit Composition
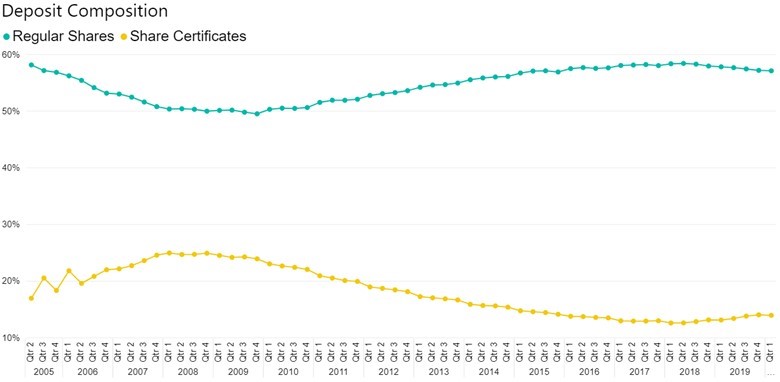
During the financial crisis we saw deposits move from certificates to regular shares. We also saw members purchasing shorter term CDs as the yield of longer-term CDs was not worth the extended term. The potential changes in deposit mix, both by term and by type, and the impact on the cost of funds should be anticipated.
Increase in Loan Charge Offs
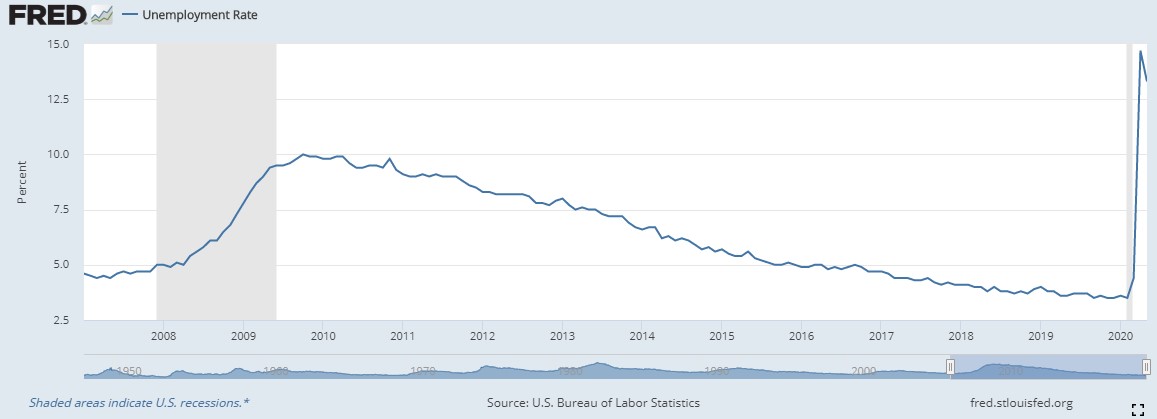
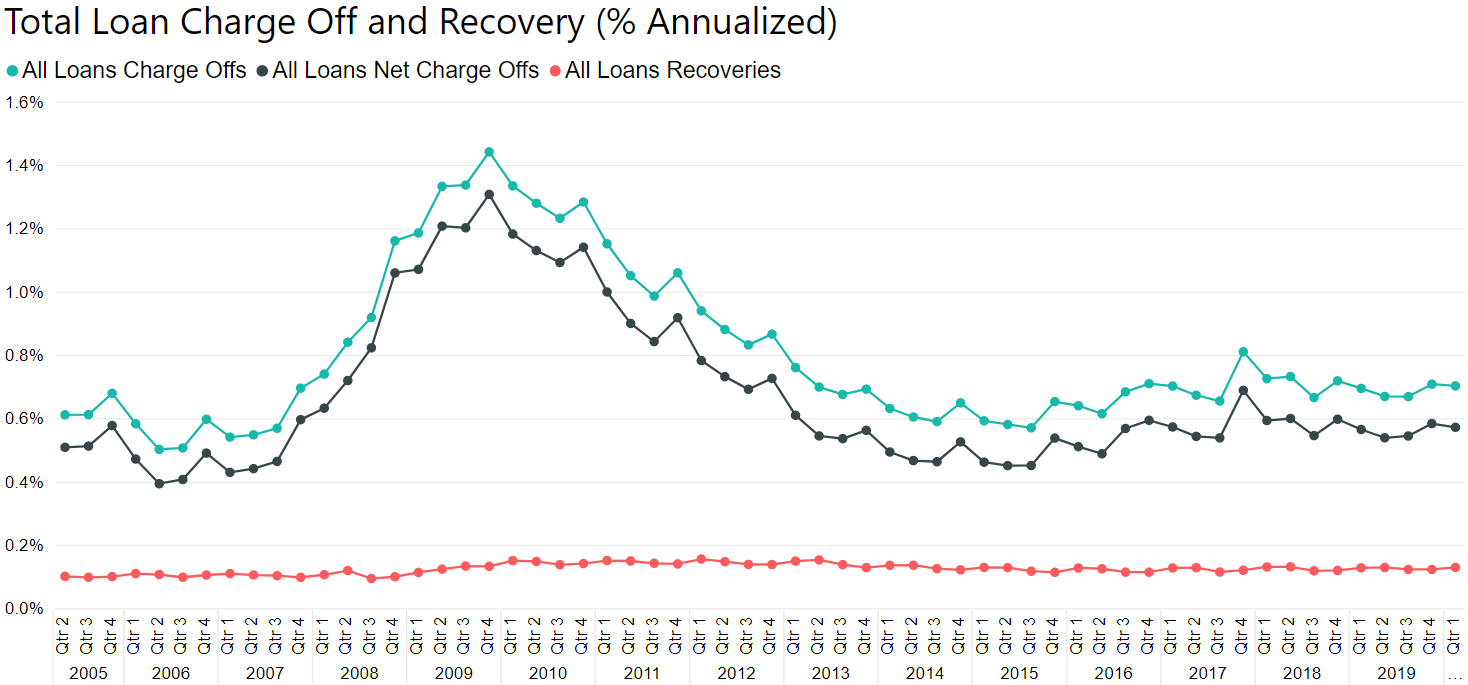
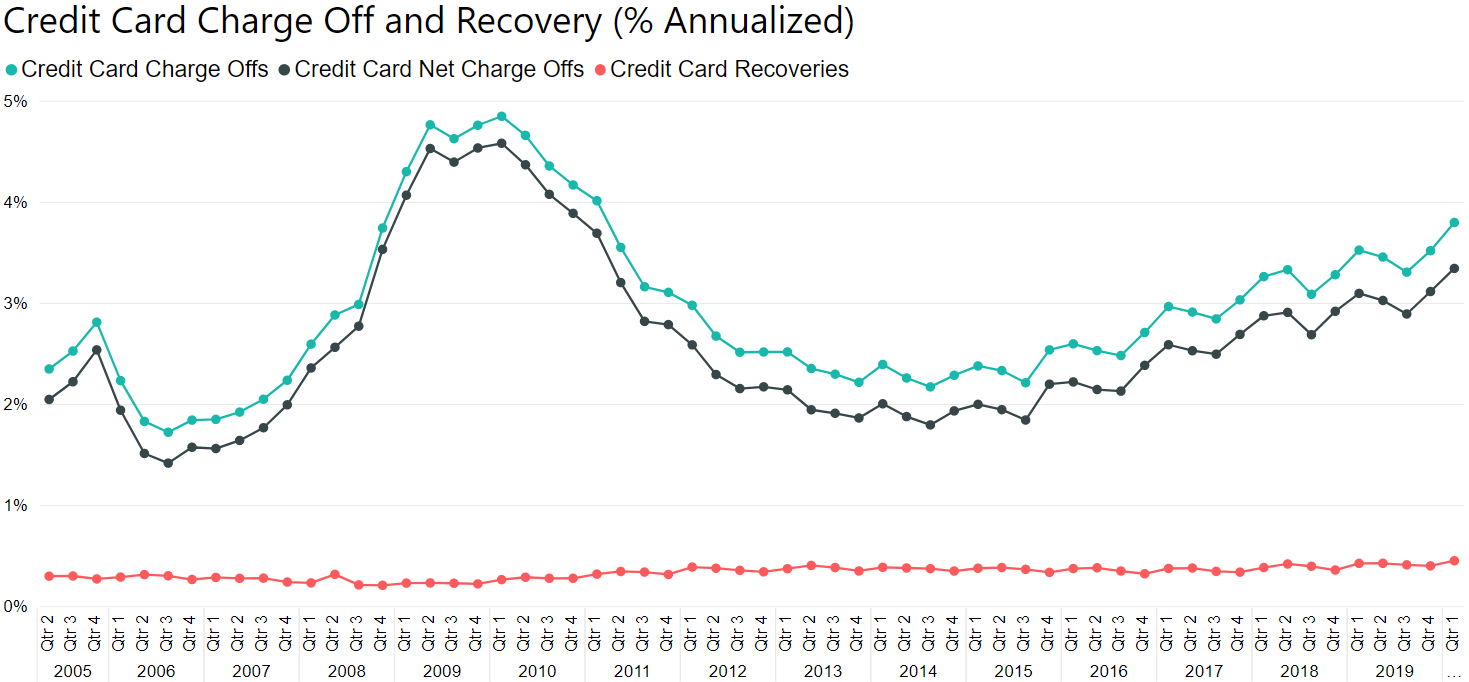
As we get further into this financial crisis and as government intervention fades, we will begin to see loan charge offs increase. The unemployment rate at the end of May was 13.3%. In comparison, the unemployment rate peaked at 10.0% during the financial crisis and the total loan charge off rate for all credit unions went from 0.40% to 1.31%. If we use the historical relationship between the unemployment rate and the charge off rate, at an unemployment of 13.3% we could expect the charge off rate to jump to 1.57% from the current 0.57%. This recession is different, so the relationship between unemployment and charge off rates may also be different. We do not have the data yet to see how unemployment has affected delinquencies or charge offs for almost all types of loans. However, credit card delinquency and charge offs have been steadily increasing over the past few years and are almost to financial crisis levels.
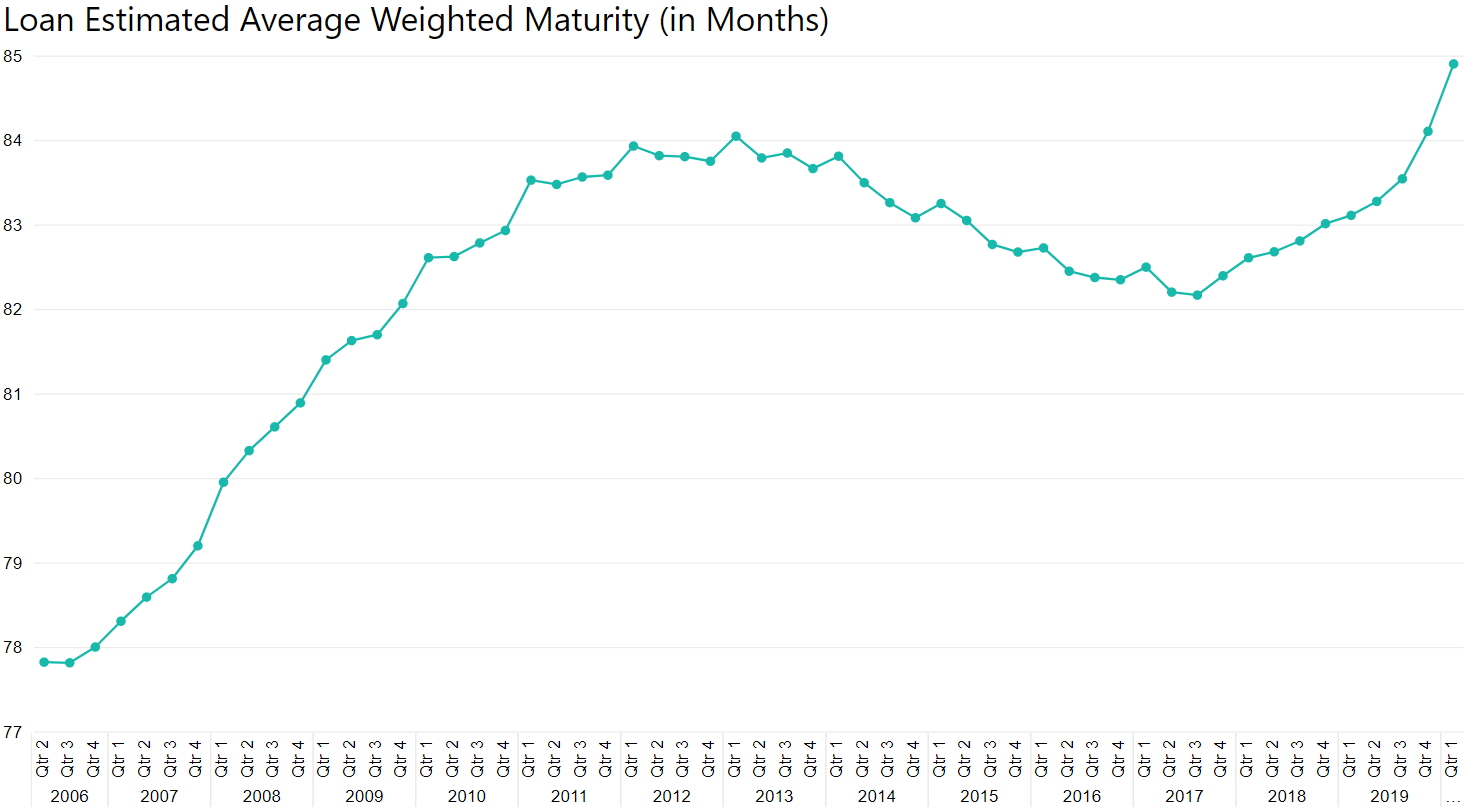
Changes in Loan Composition
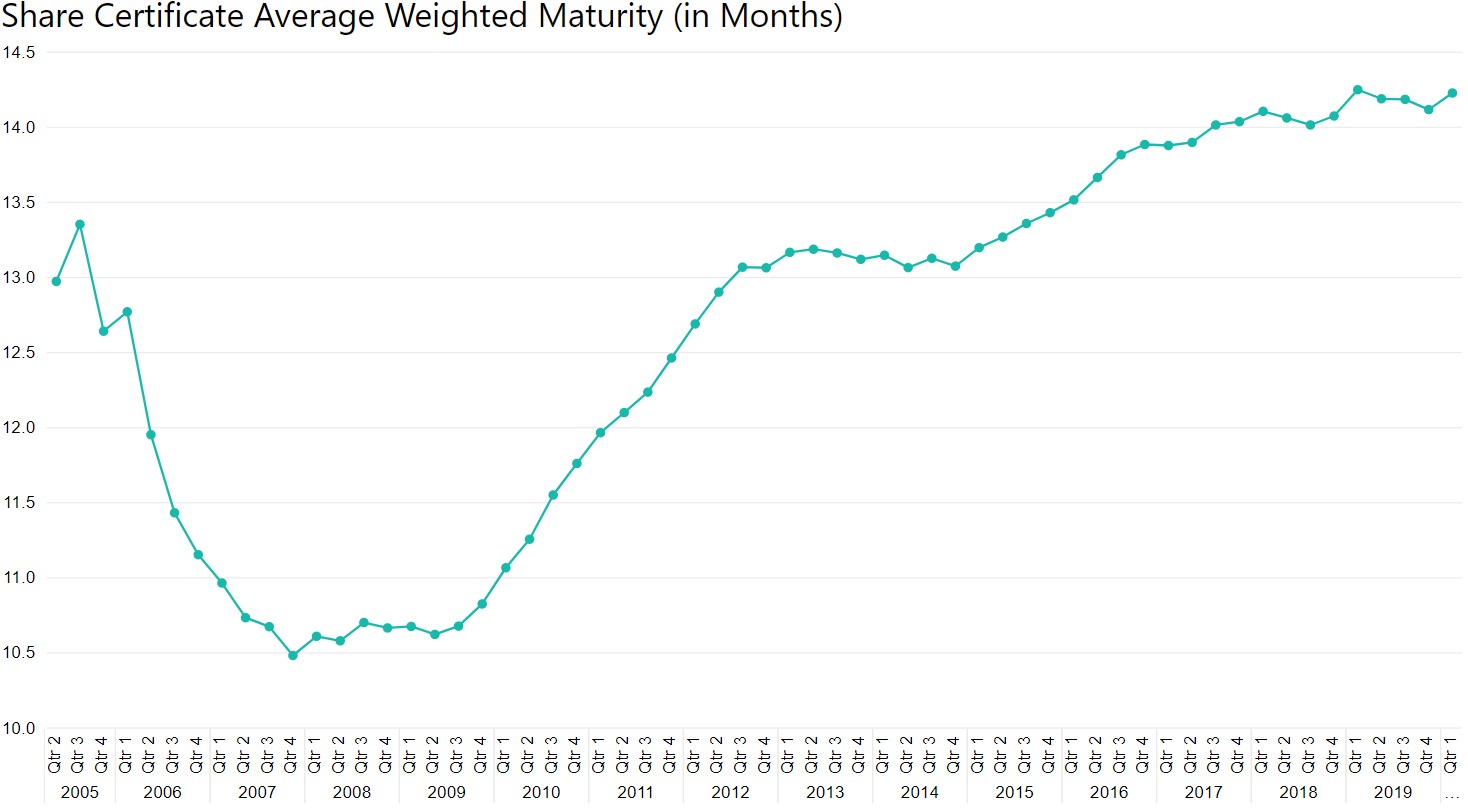
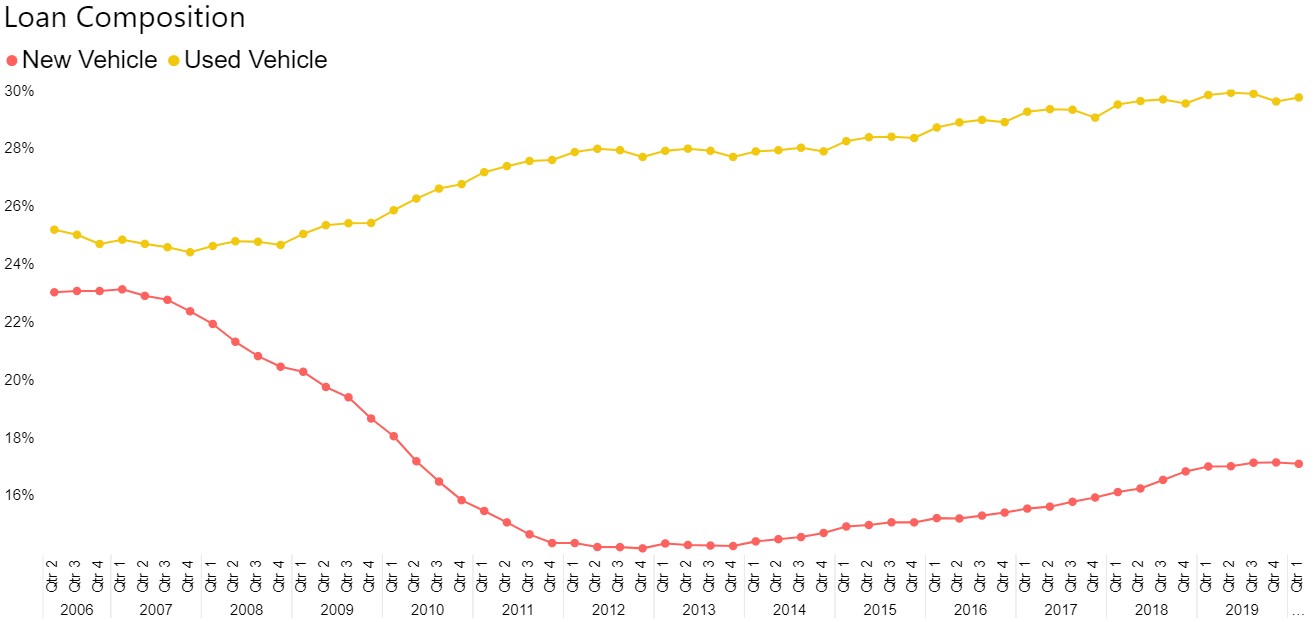
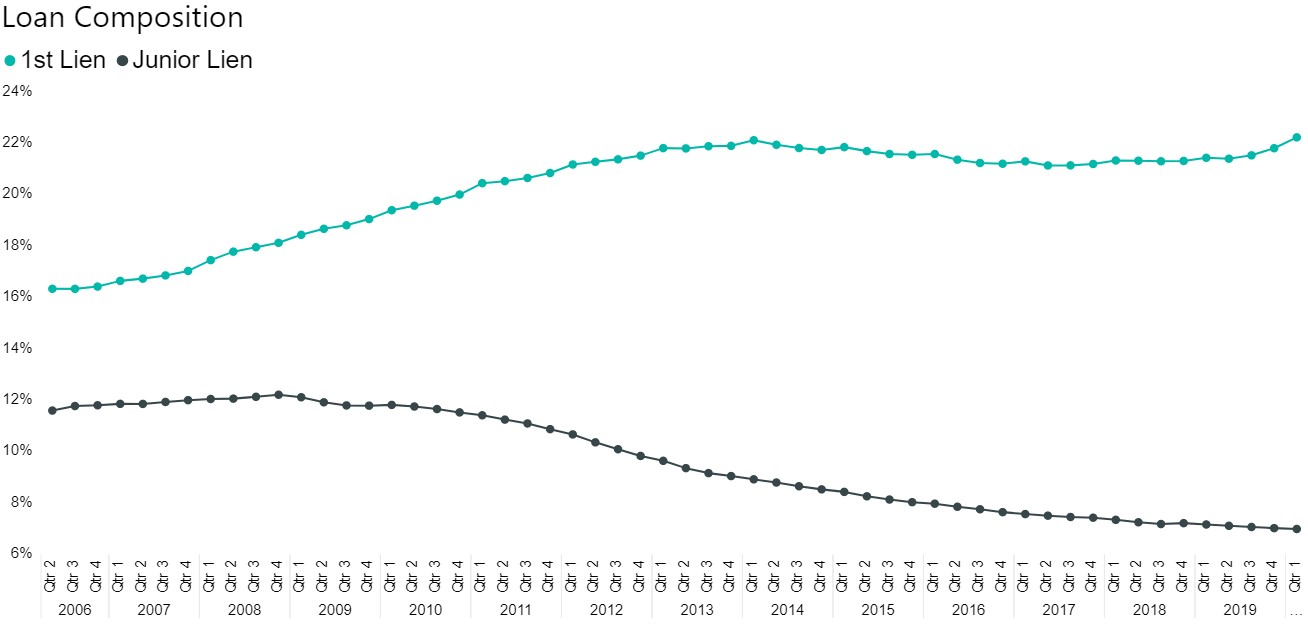
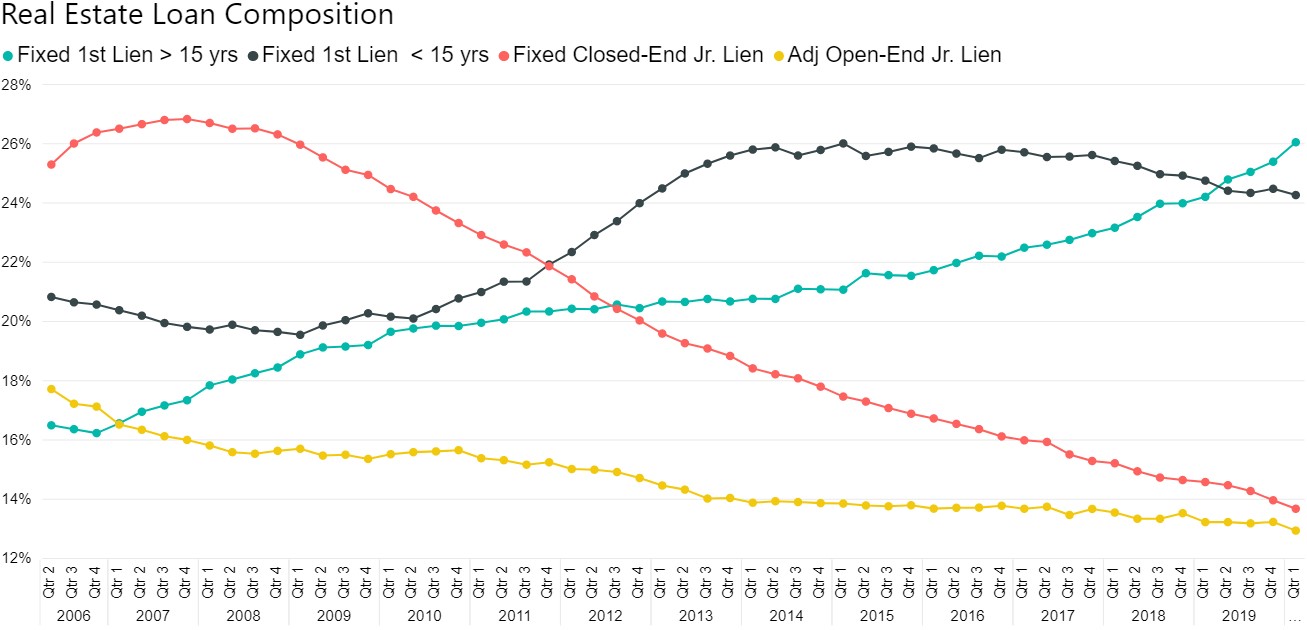
The loan composition also saw a dramatic shift during and since the financial crisis. New vehicle loans as a percentage of the loan portfolio rose during the crisis and then fell as we recovered. Used vehicle loans did the opposite. Real estate loan composition shifted and 1st liens became a much larger portion, but it appears to be offset by the decrease in home equities. It seems many people may have taken advantage of the increase in home values and refinanced or moved the Jr. lien debt into the 1st lien. This move to longer-term fixed-rate products has caused the average weighted maturity of the loan portfolio to increase, and potential interest rate risk to be greater.
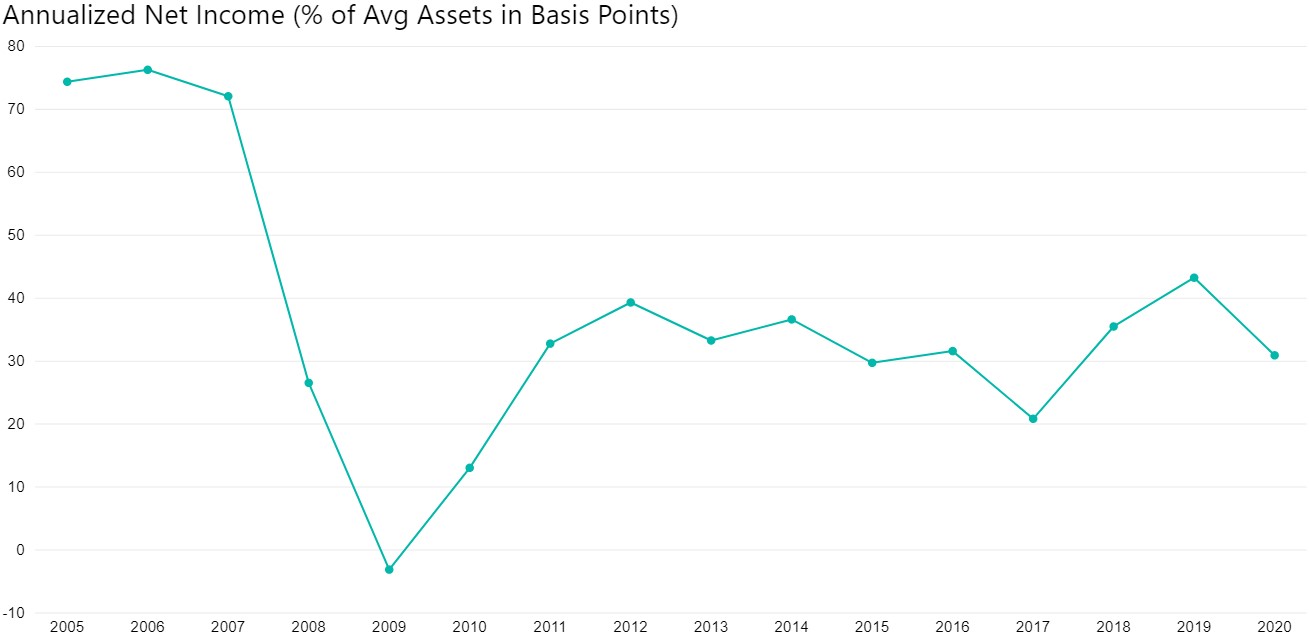
Lower Net Income
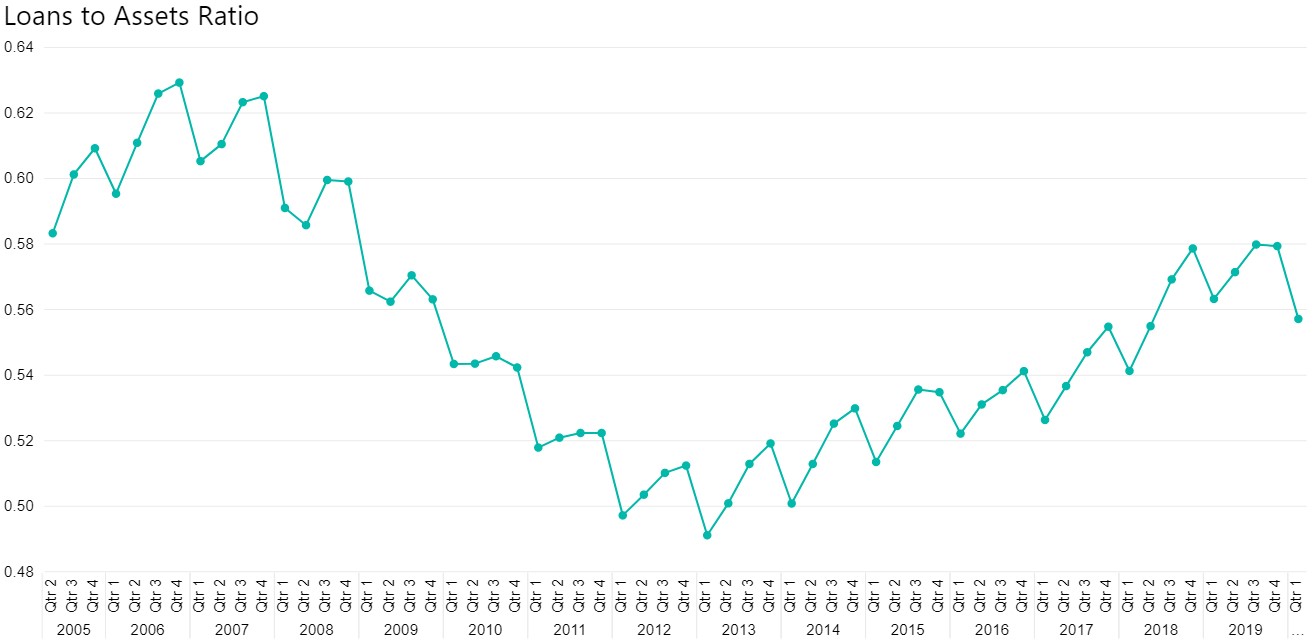
Historically, when rates are lower net income is also lower. Often, loan and investment rates drop farther than deposit rates. At the same time, many credit unions struggle to even make loans, and charge offs typically increase in a declining rate environment. The loans to assets ratio did not return to the pre-financial crisis number, and this recession may halt or erase what progress has been made. Compounding this issue is that investment rates are at or near historic lows, and all of the inflow of new deposits and reinvesting of maturing investments will be in lower-yielding instruments.
Conclusion
It is important to remember these charts and graphs represent the aggregate of the credit union industry, and many credit unions saw much more dramatic shifts in their balance sheet, charge off rates, and earnings than shown. We are presenting this information to help as credit unions explore options, anticipate changes, plan, and prepare to manage through this new crisis. Each credit union should evaluate how they performed during and since the last economic downturn and be ready for the potential for history to repeat itself. If credit unions properly prepare for this and future recessions, they can maintain healthy margins and help their members through their financial difficulties.
If you would like more information on the MHSI Peer Analysis tool and how it can be used to show your credit union and your specified peer's historical data, please contact us at info@markhsmith.com or call us at 1-800-268-7795.